Otel Collector seems doesn't work

There is 2 exercise that I still can’t complete. Could anyone help me?
I think maybe both issues are caused by the same problem.
Where I’m stuck
Exercise 1
- Hands-on Lab: Automatic Instrumentation and Instrumentation Libraries
→ Exercise 1: Zero-code Instrumentation for Java and Python
→ Instrumentation of the Python (Flask) Component (2)
Exercise 2
- Hands-on Lab: Automatic Instrumentation and Instrumentation Libraries
→ Exercise 2: Code-Based Instrumentation for Java & Python
→ Java Instrumentation Annotations (2)
Problem in Exercise 1
What I did
After running the app, I added and deleted some todos on http://localhost:5000/.
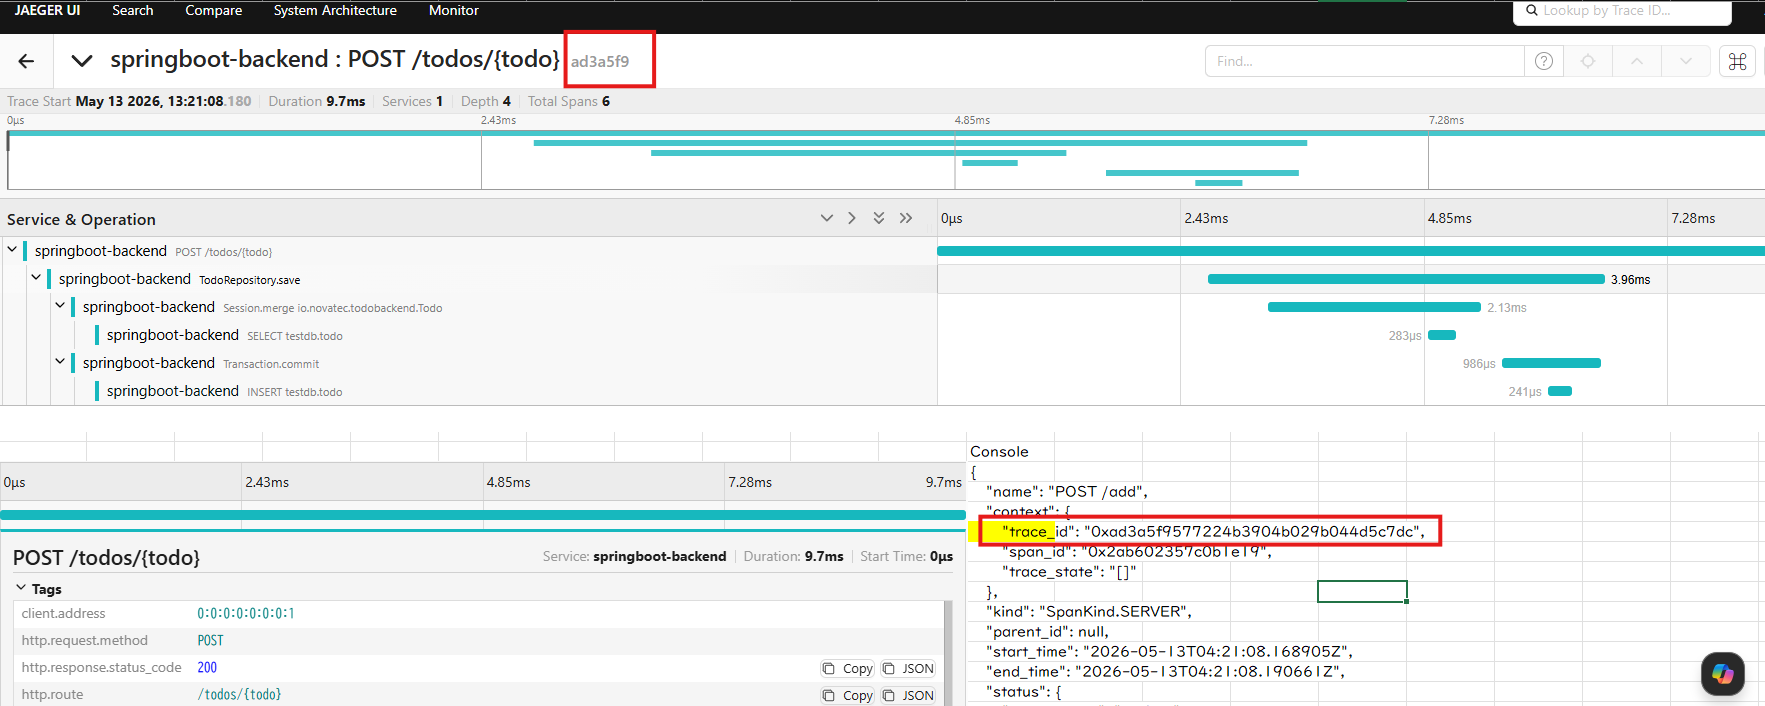
Then I opened Jaeger, but I could only find 2 services.
Also, when I selected [springboot-backend : POST /todos/{todo}], I noticed that my POST request was traced by the Java agent somehow.
I confirmed that the Jaeger container is running, and I set the trace exporter to OTLP.
PS C:\tmp\OT-Action-20260407> Test-NetConnection localhost -Port 4317

ComputerName     : localhost
RemoteAddress    : ::1
RemotePort       : 4317
InterfaceAlias   : Loopback Pseudo-Interface 1
SourceAddress    : ::1
TcpTestSucceeded : True

PS C:\tmp\OT-Action-20260407> $env:OTEL_TRACES_EXPORTER
otlp
Console Output
PS C:\tmp\OT-Action-20260407\LFS148-code\exercises\automatic-instrumentation\initial\todoui-flask> & "$env:LOCALAPPDATA\Packages\PythonSoftwareFoundation.Python.3.11_qbz5n2kfra8p0\LocalCache\local-packages\Python311\Scripts\opentelemetry-instrument.exe" python app.py

 * Serving Flask app 'app'
 * Debug mode: off

INFO:werkzeug:_internal:WARNING: This is a development server. Do not use it in a production deployment. Use a production WSGI server instead.

 * Running on all addresses (0.0.0.0)
 * Running on http://127.0.0.1:5000
 * Running on http://172.17.1.205:5000

INFO:werkzeug:_internal:Press CTRL+C to quit

INFO:root:app:GET http://localhost:8080/todos//todos/
INFO:root:app:Response: ["Leo","slow"]
INFO:werkzeug:_internal:127.0.0.1 - - [13/May/2026 11:58:56] "GET / HTTP/1.1" 200 -

{
    "name": "GET",
    "context": {
        "trace_id": "0x466c15db27a8a719c9603cfb6b1c364c",
        "span_id": "0x0f20ef0dd9f89b64",
        "trace_state": "[]"
    },
    "kind": "SpanKind.CLIENT",
    "parent_id": "0x07481fb544350c33",
    "start_time": "2026-05-13T02:58:56.273013Z",
    "end_time": "2026-05-13T02:58:56.301638Z",
    "status": {
        "status_code": "UNSET"
    },
    "attributes": {
        "http.method": "GET",
        "http.url": "http://localhost:8080/todos/",
        "http.status_code": 200
    },
    "events": [],
    "links": [],
    "resource": {
        "attributes": {
            "telemetry.sdk.language": "python",
            "telemetry.sdk.name": "opentelemetry",
            "telemetry.sdk.version": "1.26.0",
            "service.name": "todoui-flask",
            "telemetry.auto.version": "0.47b0"
        },
        "schema_url": ""
    }
}
Problem in Exercise 2
- Hands-on Lab: Automatic Instrumentation and Instrumentation Libraries
→ Exercise 2: Code-Based Instrumentation for Java & Python
→ Java Instrumentation Annotations (2)
What I did
After running the app, I added and deleted some todos on http://localhost:5000/.
Then I opened Jaeger, but I could not find the [someInternalMethod] span.
Best Answer
-
everything got solved.I have opened the wrong folder as my workspace.stupid mistake.
0
Answers
-
Sorry, please disregard my comment on the second issue.
The Jaeger screenshot threw me off — I thought I needed to find the [someInternalMethod] span at that point, but now I understand I should continue with the steps in Java Instrumentation Annotations (3).0 -
I have finished Java Instrumentation Annotations (3), but still can not find the span, I don't know why.
0 -
were you able to run 'mvn'?
0

Categories
- All Categories
- 177 LFX Mentorship
- 177 LFX Mentorship: Linux Kernel
- 769 Linux Foundation IT Professional Programs
- 379 Cloud Engineer IT Professional Program
- 175 Advanced Cloud Engineer IT Professional Program
- 75 DevOps IT Professional Program - Discontinued
- 7 DevOps & GitOps IT Professional Program
- 102 Cloud Native Developer IT Professional Program
- 7.6K Training Courses & Learning Paths
- 7 AI & ML Training
- 1 Blockchain & Decentralized Identity Training
- 16 Cloud & Containers Training
- 2 Cybersecurity Training
- 2 DevOps & Site-Reliability Training
- 1 Linux Kernel Development Training
- 2 Networking Training
- 2 Open Source Best Practice Training
- 4 System Administration Training
- 1 System Engineering Training
- 2 Web & Application Development Training
- 796 Hardware
- 202 Drivers
- 68 I/O Devices
- 37 Monitors
- 95 Multimedia
- 173 Networking
- 91 Printers & Scanners
- 91 Storage
- 771 Linux Distributions
- 81 Debian
- 68 Fedora
- 23 Linux Mint
- 13 Mageia
- 24 openSUSE
- 151 Red Hat Enterprise
- 31 Slackware
- 13 SUSE Enterprise
- 356 Ubuntu
- 466 Linux System Administration
- 31 Cloud Computing
- 73 Command Line/Scripting
- Github systems admin projects
- 98 Linux Security
- 79 Network Management
- 101 System Management
- 46 Web Management
- 127 Mobile Computing
- 20 Android
- 92 Development
- 1.2K New to Linux
- 1K Getting Started with Linux
- 400 Off Topic
- 124 Introductions
- 32 Study Material
- 1K Programming and Development
- 310 Kernel Development
- 705 Software Development
- 1K Software
- 409 Applications
- 182 Command Line
- 5 Compiling/Installing
- 70 Games
- 318 Installation
- Archived
- 183 Small Talk
- 2 LFD140 Class Forum
- 1.4K LFS258 Class Forum
Upcoming Training
-
August 20, 2018
Kubernetes Administration (LFS458)
-
August 20, 2018
Linux System Administration (LFS301)
-
August 27, 2018
Open Source Virtualization (LFS462)
-
August 27, 2018
Linux Kernel Debugging and Security (LFD440)